Let's say your POST /orders API is taking 5 seconds. Behind it, the Order Service calls Inventory Service, Payment Service and Notification Service, and some of them talk to databases.
Metrics tell you the API is slow. Logs of four services are lying in four different places. So which service is slow, and which step inside it?
This is the problem distributed tracing solves.
What is distributed tracing?
Distributed tracing is tracing the flow of a request as it travels through a distributed system.
Think of a courier parcel. You get one tracking number, and you can see every stop it made: pickup, warehouse, hub, delivery, with time spent at each stop. A trace does the same thing for your request.
Trace and Span
- Trace: the complete journey of a request (the entire trip)
- Span: each step in that journey is recorded as a span
So a trace is a set of spans and their parent-child relationship.
For our order example, it looks like this (numbers are only for illustration):
Trace: POST /orders                                   total 820 ms

order-service      POST /orders                        820 ms   <- root span
 |-- inventory-service   GET /stock                   120 ms   <- child of root
 |    '-- DB: SELECT stock                              90 ms   <- child of inventory
 '-- payment-service     POST /pay                    600 ms   <- child of root
      '-- DB: INSERT payment                          540 ms   <- slow step
Just by reading the tree, you know the DB insert inside Payment Service is the bottleneck. No guessing, no digging in four log files.
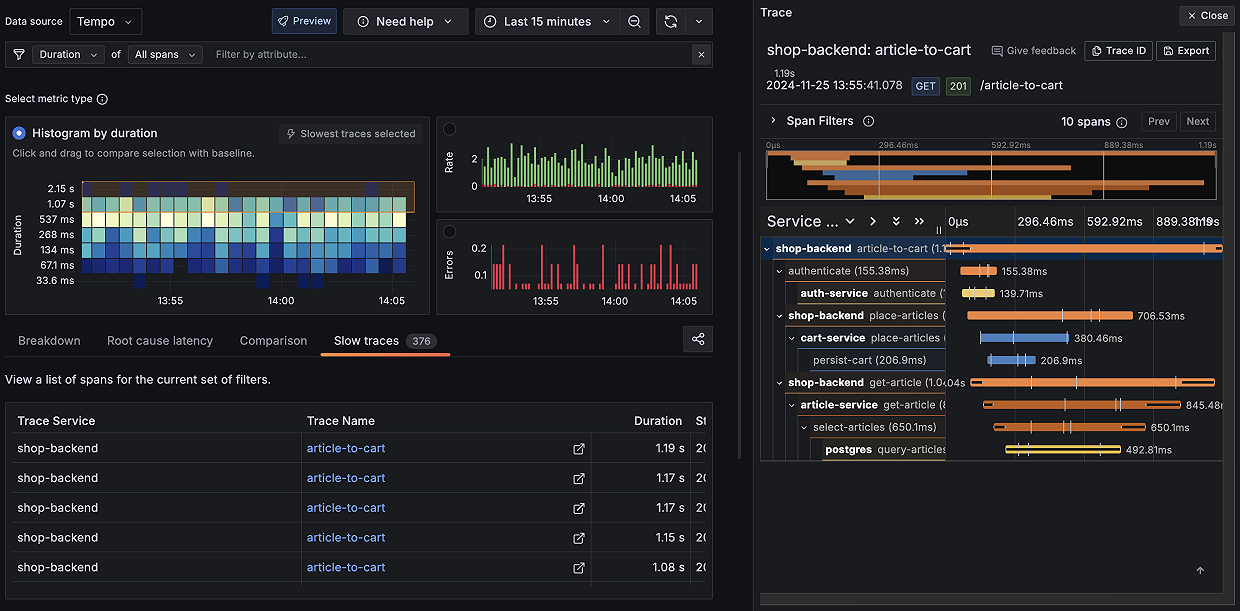
How do spans get created?
Creating spans is part of instrumentation, which means adding observability features to the application.
With automatic / zero code instrumentation, we use an agent. The agent captures a span for each operation in a request, like an incoming HTTP call, an outgoing HTTP call or a DB query. By linking these spans together, we get the complete trace of that request.
Your business code does not change.
Observability architecture
Now the next question: where does all this telemetry go? We do not want the app to talk to Prometheus, Loki, Tempo and Datadog directly. That makes the app tightly coupled to the backends.
So the flow is:
+---------------------+     OTLP     +------------------------------+
|  Your application   | -----------> |        OTel Collector        |
|  + OTel agent       |              |  receive -> process -> export |
+---------------------+              +--------------+---------------+
                                                    |
        +------------------+------------------+-----+------------+
        |                  |                  |                  |
   Prometheus /       Loki /            Tempo /            Datadog /
   InfluxDB           Elasticsearch     Zipkin             New Relic ...
   (metrics)          (logs)            (traces)           (all signals)
        |                  |                  |
        +------------------+------------------+
                           |
                       Grafana
                (visualizer / frontend)
- OTel agent runs with the app and emits telemetry signals (logs, metrics, traces)
- OTel Collector receives them and sends them to the right observability backend.
- Observability Backends store the data: Prometheus and InfluxDB for metrics, Loki and Elasticsearch for logs, Tempo and Zipkin for traces. Datadog, New Relic and ELK are full platforms
- Grafana is the frontend where we visualize all this
Because of this, the application is decoupled from the observability backend. Tomorrow if you want to move from Zipkin to Tempo, you change the Collector config. The application stays untouched.

OTel Collector
The OTel Collector is a vendor agnostic proxy that receives, processes and exports telemetry data.
- A central hub for all observability data
- It decouples our app from the destination of telemetry data
- Works as a pipeline of three parts: receivers (take data in, for example OTLP), processors (batch, filter, add attributes) and exporters (send data to the backends)
How does the trace stay connected across services?
When Order Service calls Payment Service over HTTP, Payment Service has no idea which trace this call belongs to. So the caller sends this information in an HTTP header called traceparent. This is the W3C Trace Context standard.
traceparent: 00-0af7651916cd43dd8448eb211c80319c-b7ad6b7169203331-01
traceparent = version + trace id + span id + trace flag
| Part | Example | Meaning |
|---|---|---|
| Version | 00 |
Version of the format |
| Trace id | 0af7651916cd43dd8448eb211c80319c |
Same for the entire trip, every service uses this |
| Span id | b7ad6b7169203331 |
The caller's span. Receiver uses it as the parent |
| Trace flag | 01 |
01 means this trace is sampled (recorded) |
Payment Service reads this header, creates its own span with the same trace id, and sets the received span id as its parent. This is how the parent-child relationship is established across services.
What about concurrent requests?
In real life thousands of requests hit the same services at the same time. Spans of all these requests are mixed up in the Collector and the backend.
The trace id keeps them apart. All spans with the same trace id belong to one request. Inside that trace, the parent span id arranges them into a tree.
Why default tracing breaks in concurrent code
Inside one service, OTel keeps the current trace context in a ThreadLocal by default. That means every thread has its own copy.
This is good when one thread handles one request, because two requests never mix up.
But it breaks when your code hands the work to another thread, for example @Async, an ExecutorService or CompletableFuture. The new thread has an empty context, so it does not know who the parent is. The span starts a new trace or becomes an orphan, and your trace is broken in the middle.
The fix is to carry the context to the new thread. The OTel Java agent already does this for common executors. In manual code, you can wrap the task yourself, for example with Context.current().wrap(runnable) or Context.taskWrapping(executor).
Quick recap
- Distributed tracing = tracing the flow of a request across a distributed system.
- Trace = complete journey. Span = one step. A trace is a set of spans with parent-child relationship.
- Agent (zero code) captures a span for each operation, and linking them gives the full trace.
- App -> OTel agent -> OTel Collector -> backends -> Grafana. The Collector decouples the app from the backends.
traceparent(W3C Trace Context) = version + trace id + span id + trace flag. It carries the trace across services.- Default context is thread local, so it breaks when work moves to another thread unless the context is propagated.
Comments
Join the discussionNo comments yet. Be the first to comment.
